Doubles
Introduction
This is the first in a serie of articles looking at the doubles that are hit by players to win legs of darts.
The aim of this analysis is to start looking at some darts data. The intention isn’t really to provide anything ground-breaking, but more to poke around, start building up a toolset that can be used for future analyses, and validate the dataset. It will also allow me to play around with data visualisations.
Data
The data for this has been collected from the dartsdata website. For the purposes of this analysis, I’ll be looking at the European tour matches for 2017 and 2018.
For ease of processing, I’ve extracted the data into csv files which I then load in as follows:
Since the data in the csv files is still slightly messy. The last filter line leaves me with only throws that could have been double attempts (i.e. score less than 50 and an even number)
The dataset contains 22070 double attempts.
Analysis
Summarising the data
The first thing to look at are the most common doubles attempted. To do this, I first need to summarise the dataset. The raw data contains a field, “score before”, which is the number of points remaining before that dart is thrown. I’m using this as the grouping variable, and creating summarised varibles for the number of attempts, number hit and the success percentage.
Finally, in darts it is far more common to talk in terms of ‘doubles’, rather than score remaining (i.e. you would say Double 20, rather than 40), so I’m adding a “double” field to hold this value.
Number of attempts
I’ve plotted the data for attempts below:
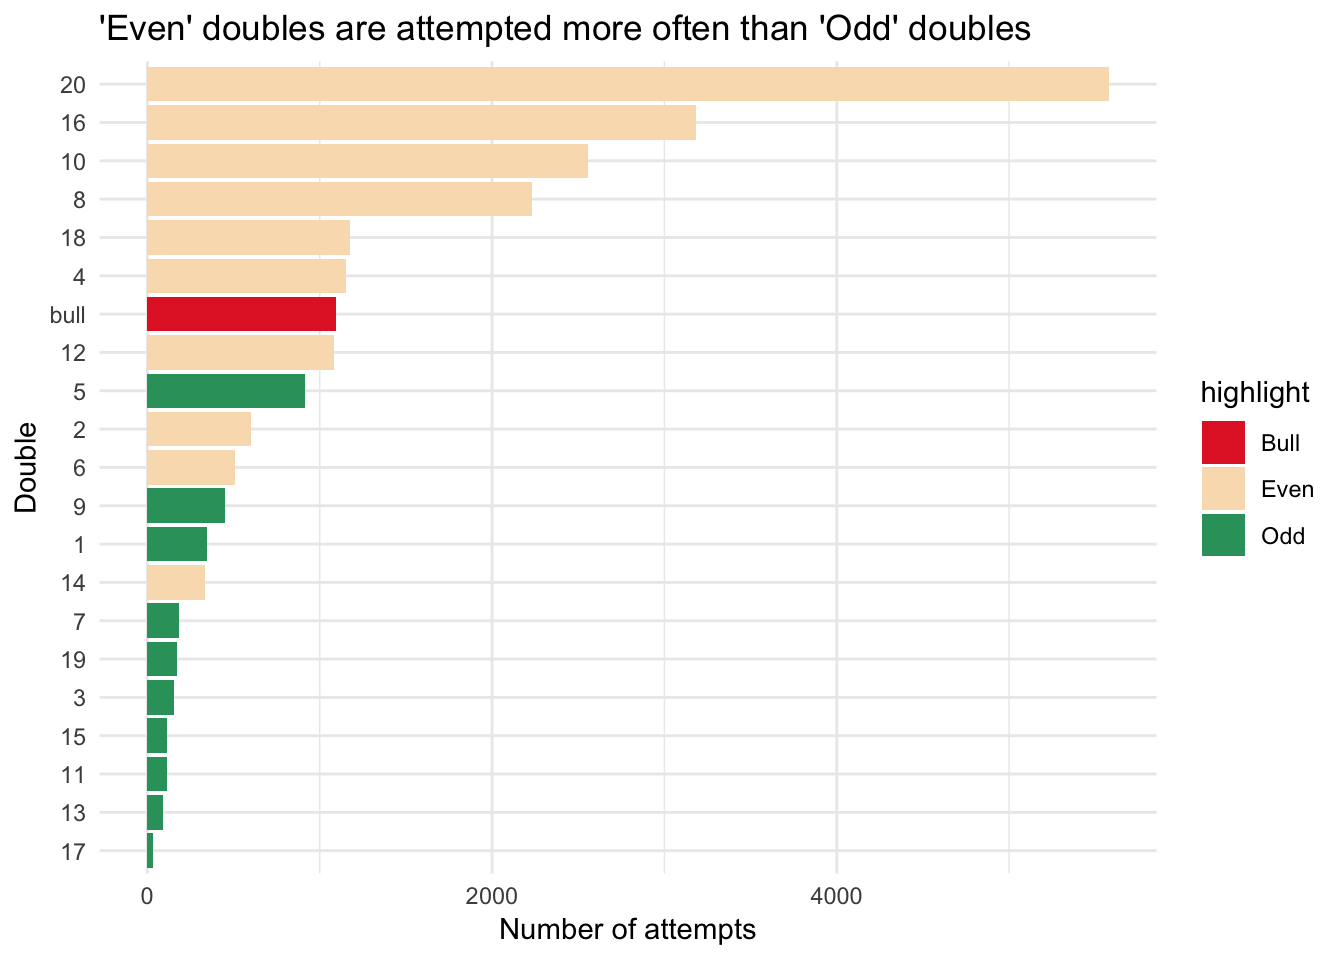
The most obvious standout here is how the top 4 numbers are clearly ahead of the others - 20, 16, 10 and 8. From a game point of view, this makes sense - 20 and 16 are the 2 most commonly attempted, and if the player misses on the inside, they move to 10 and 8 respectively. In a similar vein, it’s striking just how many of the most attempted doubles are even numbers (i.e. if the player misses on the inside, they still leave another attempt at a double). The most commonly attempted odd double is double-5, which is only the 9th most attemped double.
Number of times successfully hit
I can make a similar plot showing how often each double is actually hit:
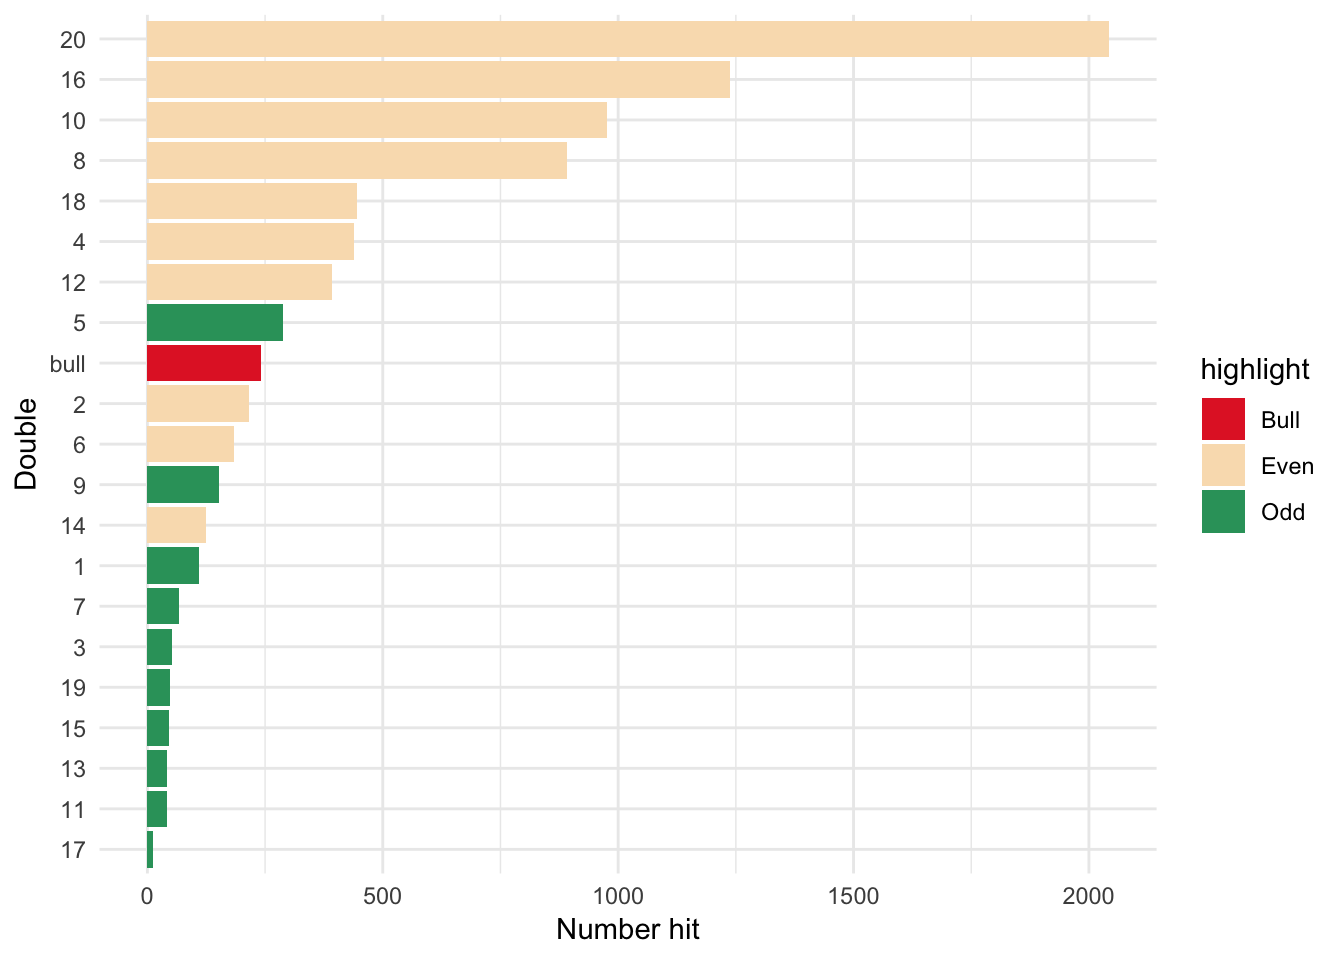
As expected, the order of the doubles hit is pretty much in line with those attempted - the main exception being the bullseye which is hit far less often than it is attempted.
Success Rate
The final bar chart shows the success rate (i.e. doubles hit / doubles attempted) for each double:

Now, the first thing to call out here is the difference in sample sizes between the doubles - there were over 5000 attempts at double-20, versus less than 100 attempts at double-13. I’ll have a look at factoring this into the results in a future article.
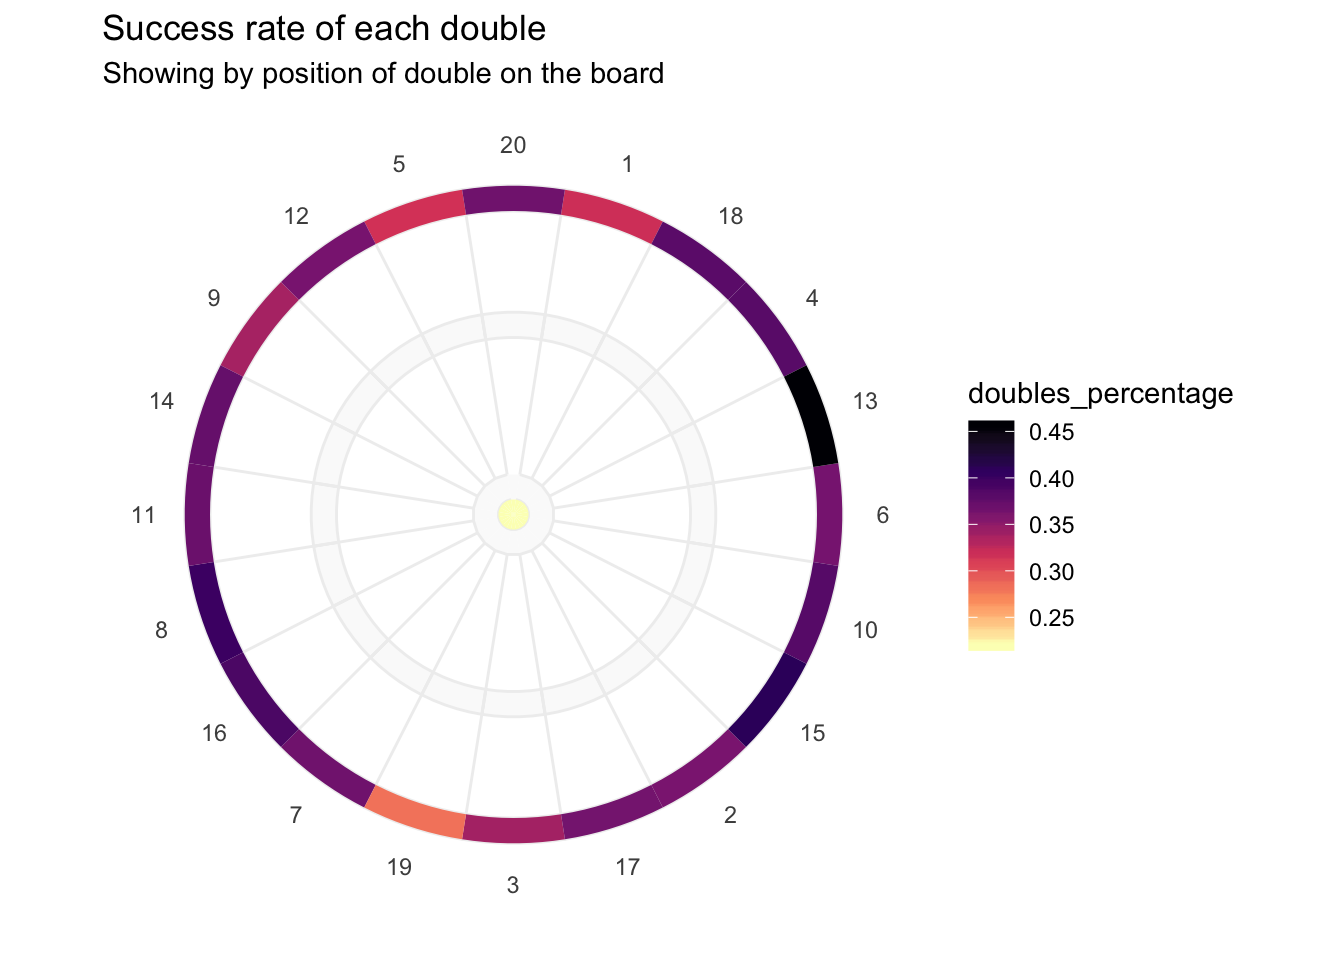
Aside from that, the most obvious standout is how much lower the success rate for bullseye is than for any other double.
An alternative visualisation
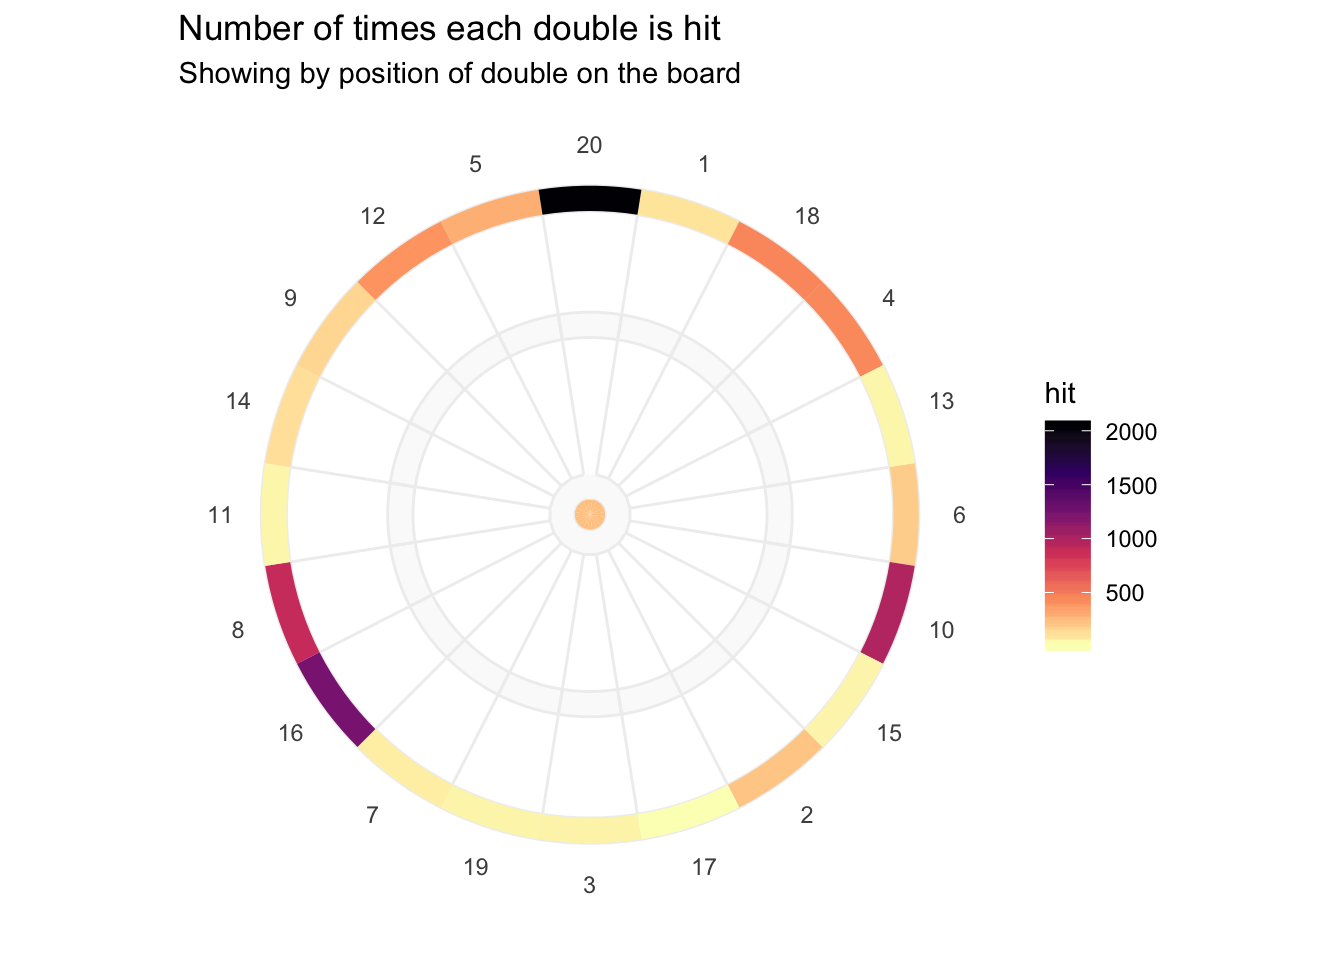
Whilst the bar charts do a good job of showing the values, it might also be fun to try out a visualisation that better represents the game itself. This time, I’m going to show the same data, but this time represented as a dart board.
In order to do this, the first thing we need to do is to draw the board. After a bit of work, I’ve come up with the following that produces a greyscale darts board. The key elements here are to set the “double” field as an ordered factor that represents the ordering of the numbers on a dartboard (e.g. a double-20 is also known as double-top, etc) and the use of coord_polar to convert the values into a circular board.

Once a greyscale board can be drawn, the values can be added as an additional plot layer. Here I’m using the fill aesthetic to show the values.
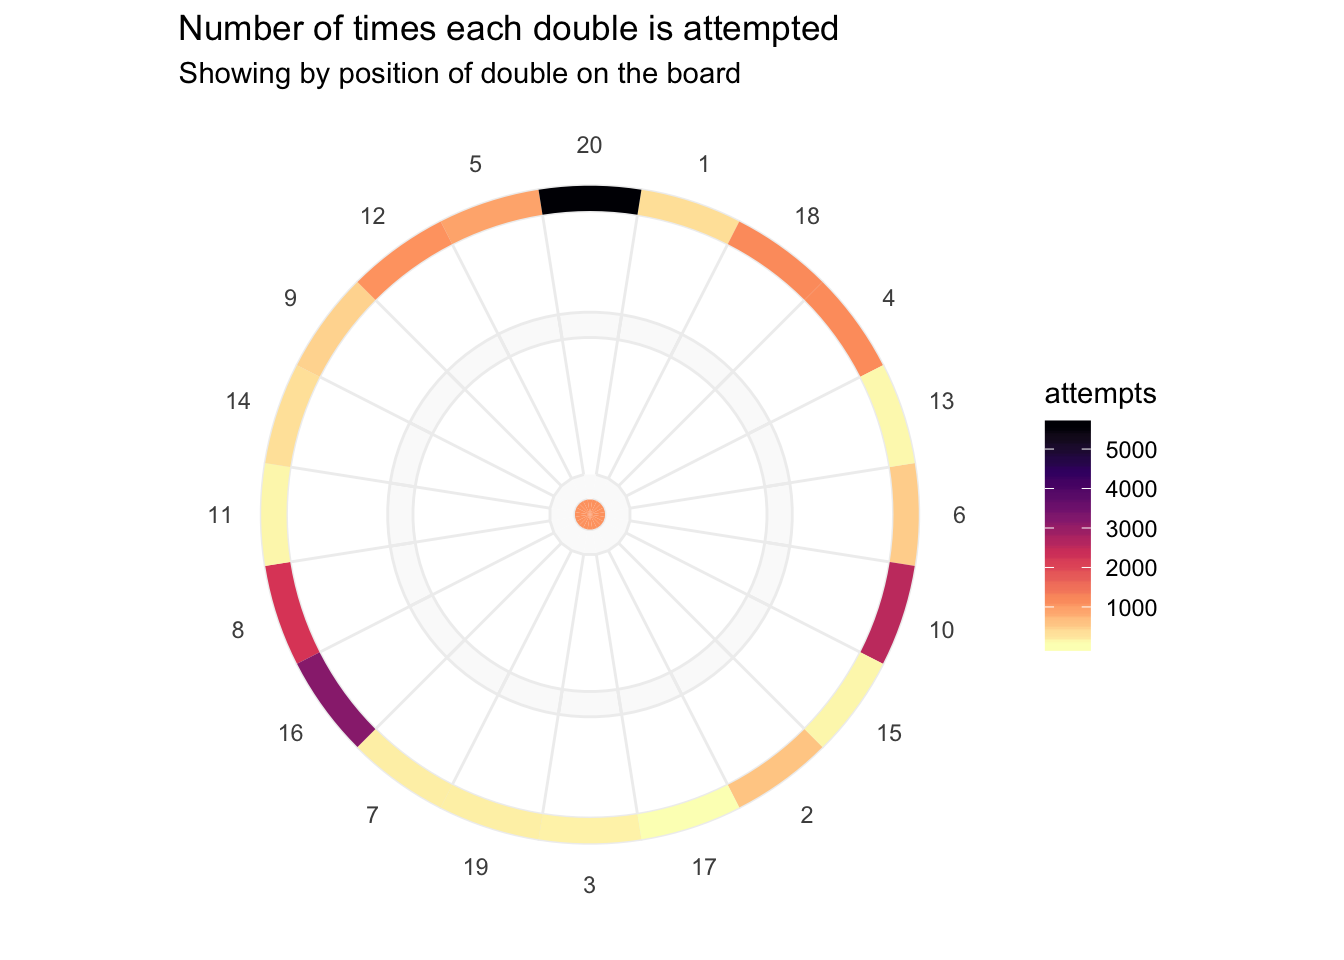
This can be repeated to show doubles hit and the success rate
Finally, the same visualisation style, but for success rate:
